Original image credit: https://pixabay.com/ (The original image was edited.)
Data Data: Load here
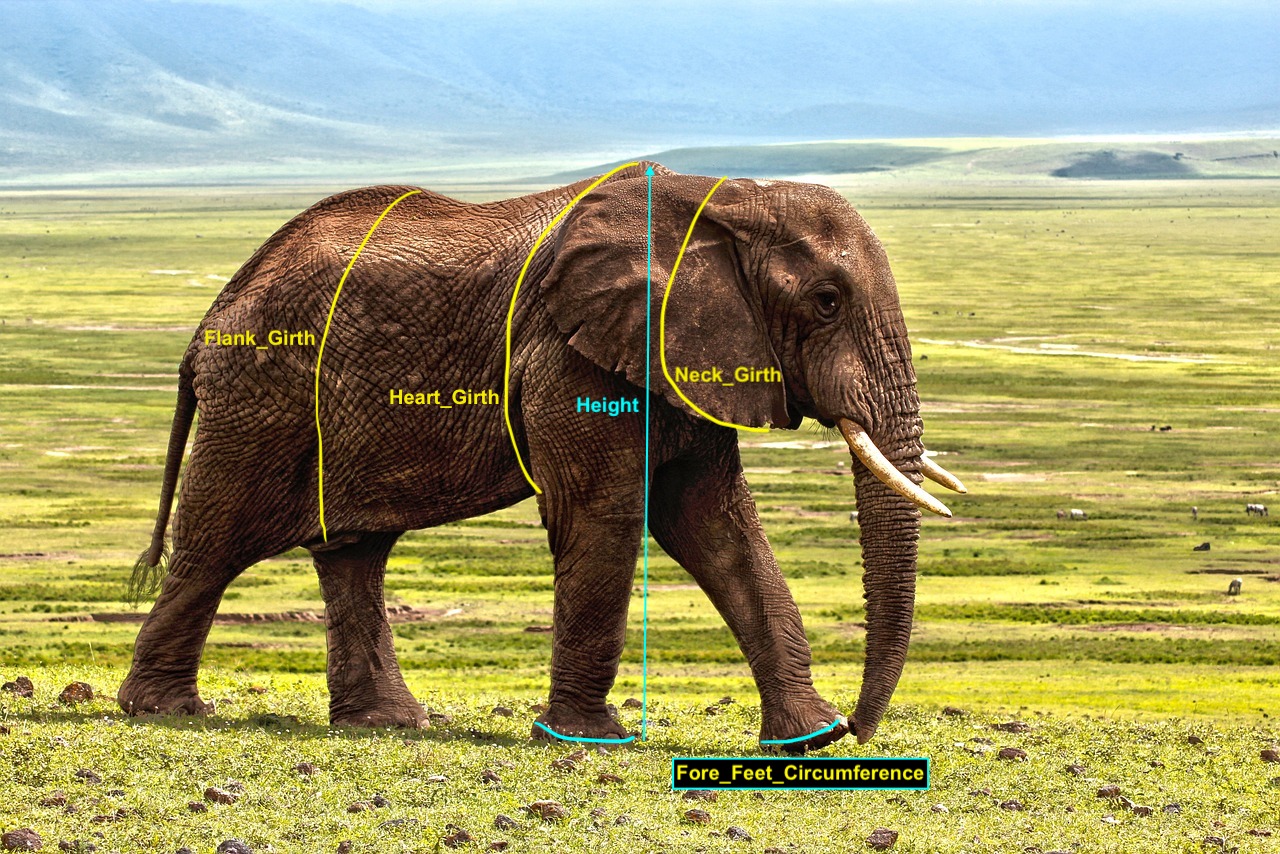
Variable Description Variable name Variable description Category category (African, Asian) Age_Category age category (“less than 10 years”, “10-20 years”, “greater than 20 years”) Gender elephant gender (male, female) Flank_Girth flank girth in meters Heart_Girth heart girth in meters Neck_Girth neck girth in meters Weight body weight in meters Height shoulder height in meters Fore_Feet_Circumference Average fore feet circumference in meters Task Please create at least one data visualization graphic using both Python and R programming languages.
Continue reading